🎈
Band 6 Model Answer
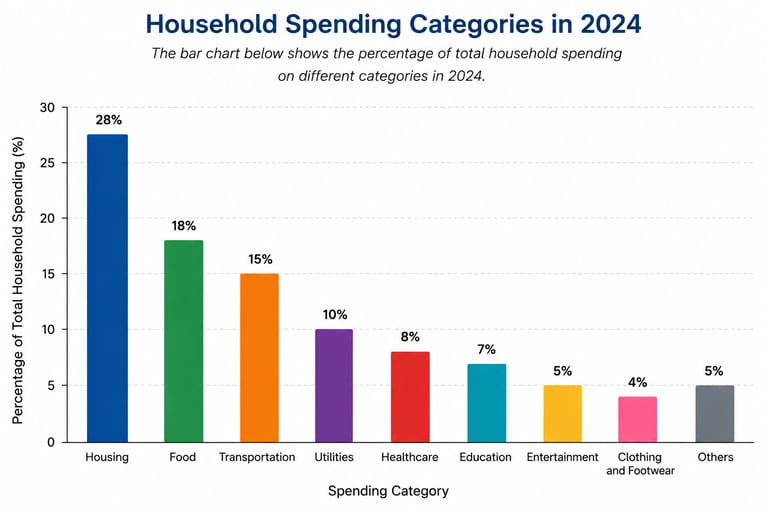
The bar chart shows the percentage of total household spending on different categories in 2024.
Overall, housing was the largest expense for households, while clothing and footwear accounted for the smallest proportion. Food and transportation were also significant spending categories. Looking at the details, housing represented 28% of total household expenditure. Food was the second highest category at 18%, followed by transportation at 15%. Utilities made up 10% of spending.
The remaining categories accounted for smaller percentages. Healthcare and education represented 8% and 7% respectively. Entertainment and other expenses were both 5%, while clothing and footwear had the lowest figure at just 4%.
In conclusion, households spent most of their money on essential needs such as housing, food, and transportation, whereas less money was allocated to clothing and entertainment.
Word Count: 129
Band 7 Model Answer
The bar chart illustrates how households distributed their spending across nine different categories in 2024.
Overall, housing accounted for the highest proportion of expenditure, whereas clothing and footwear represented the smallest share. It is also noticeable that essential items such as housing, food, and transportation made up the majority of household spending.
In detail, housing was the largest category, accounting for 28% of total expenditure. Food ranked second at 18%, while transportation represented 15%. Together, these three categories comprised more than half of overall household spending.
Among the remaining categories, utilities accounted for 10%, followed by healthcare and education at 8% and 7%, respectively. Spending on entertainment and other items was equal, with both categories making up 5% of total expenditure. By contrast, clothing and footwear had the lowest proportion, at only 4%.
Overall, the chart suggests that households prioritized basic living expenses over less essential purchases.
Word Count: 160
Band 8 Model Answer
The bar chart illustrates the percentage of total household expenditure allocated to nine different spending categories in 2024.
Overall, housing accounted for the largest proportion of household spending, while clothing and footwear represented the smallest share. Essential expenses such as housing, food, and transportation made up the majority of total expenditure.
In detail, housing was by far the biggest expense, accounting for 28% of total household spending. Food was the second-largest category at 18%, followed by transportation at 15%. Together, these three categories represented more than 60% of overall expenditure.
The remaining categories accounted for considerably smaller proportions. Utilities made up 10% of household spending, while healthcare and education represented 8% and 7%, respectively. Expenditure on entertainment and other items was identical at 5% each. Clothing and footwear received the lowest allocation, accounting for only 4% of total spending.
Overall, the data indicate that households prioritized essential living costs, particularly housing and food, while spending relatively less on discretionary categories such as entertainment and clothing.
Word Count: 169
Band 9 Model Answer
The bar chart compares the proportions of total household expenditure devoted to various spending categories in 2024.
Overall, housing dominated household budgets, whereas clothing and footwear accounted for the smallest share of expenditure. It is also evident that necessities, including housing, food, and transportation, consumed a substantial majority of household spending.
Looking first at the largest categories, housing represented 28% of total expenditure, making it the most significant expense by a considerable margin. Food was the second-largest category at 18%, while transportation accounted for 15%. Combined, these three areas absorbed 61% of household budgets, highlighting their importance in everyday life.
By contrast, all remaining categories individually accounted for less than 10% of spending. Utilities constituted 10%, followed by healthcare and education at 8% and 7%, respectively. Expenditure on entertainment and miscellaneous items was identical, each standing at 5%. The smallest proportion was allocated to clothing and footwear, which made up just 4% of total household spending.
In summary, household expenditure was heavily concentrated on basic living necessities, with comparatively limited spending on non-essential goods and services.
Word Count: 187